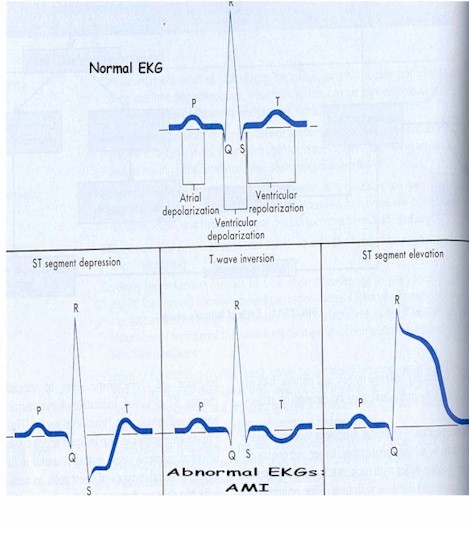
(Graphic from McAnce, Understanding Pathophysiology, Mosby 1996)
What is an electrocardiogram?
Instructor's Note:
The upper diagram is the normal heartbeat as viewed on the electrocardiogram (ECG). The bottom three are ECGs from myocardial infarctions in different areas of the heart's ventricles. We see Mr. Dixon's type of ECG pattern on the left, with the depressed S-T segment presumptively indicating a ventricular infarction.
